No results, please enter a search term above
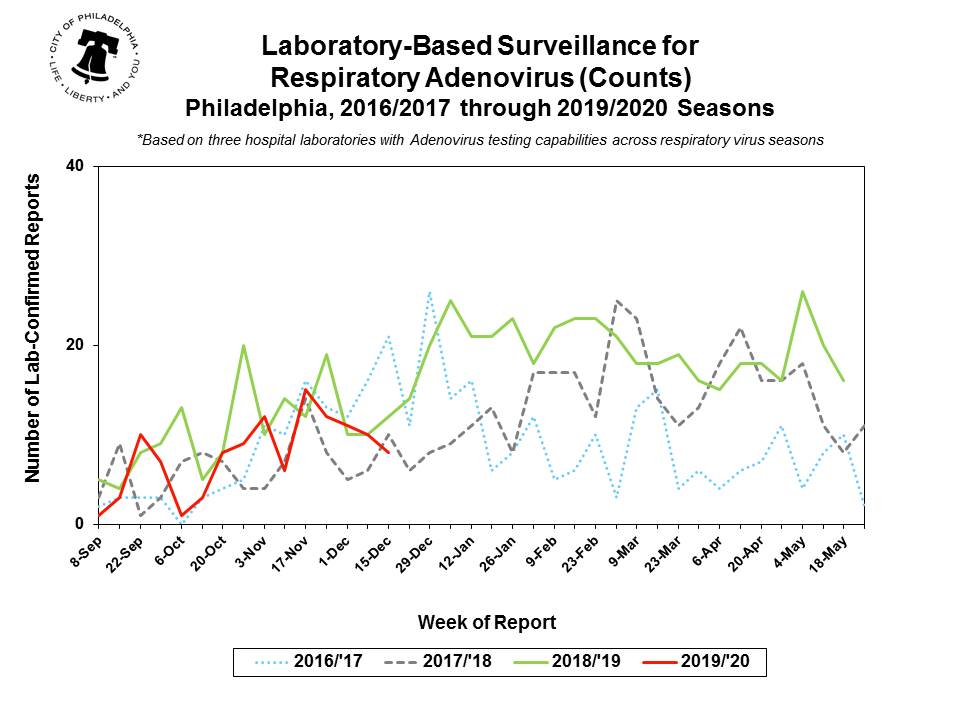
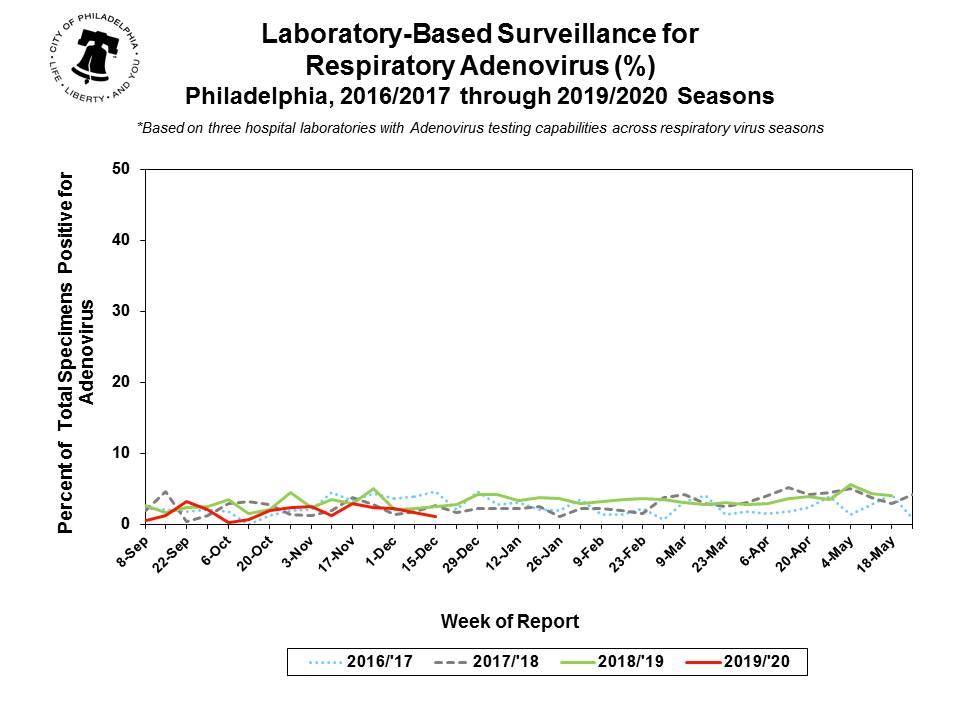
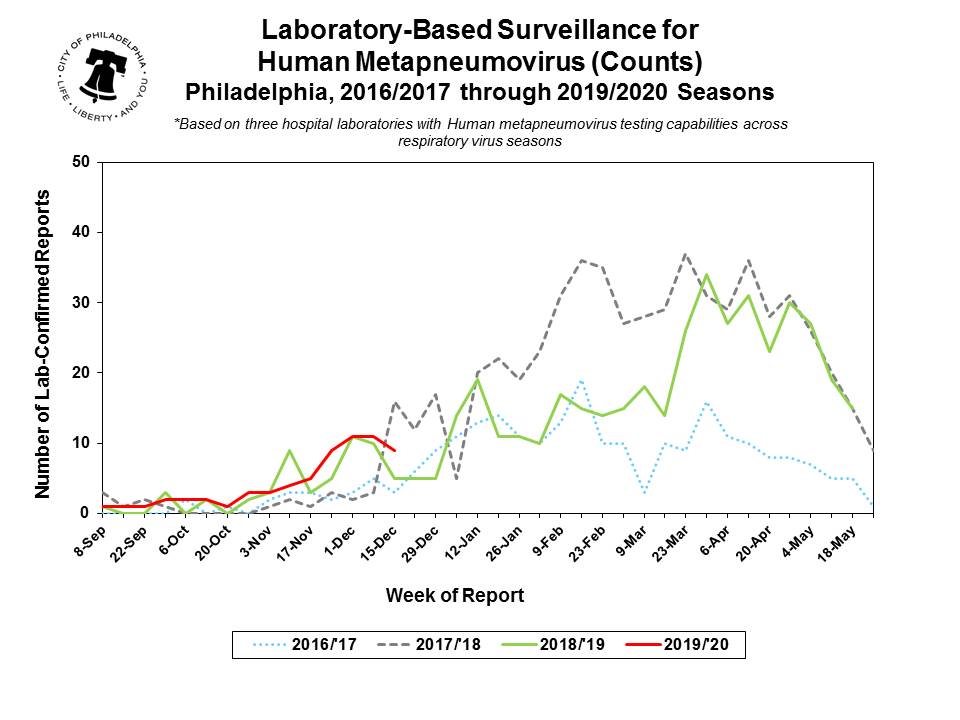
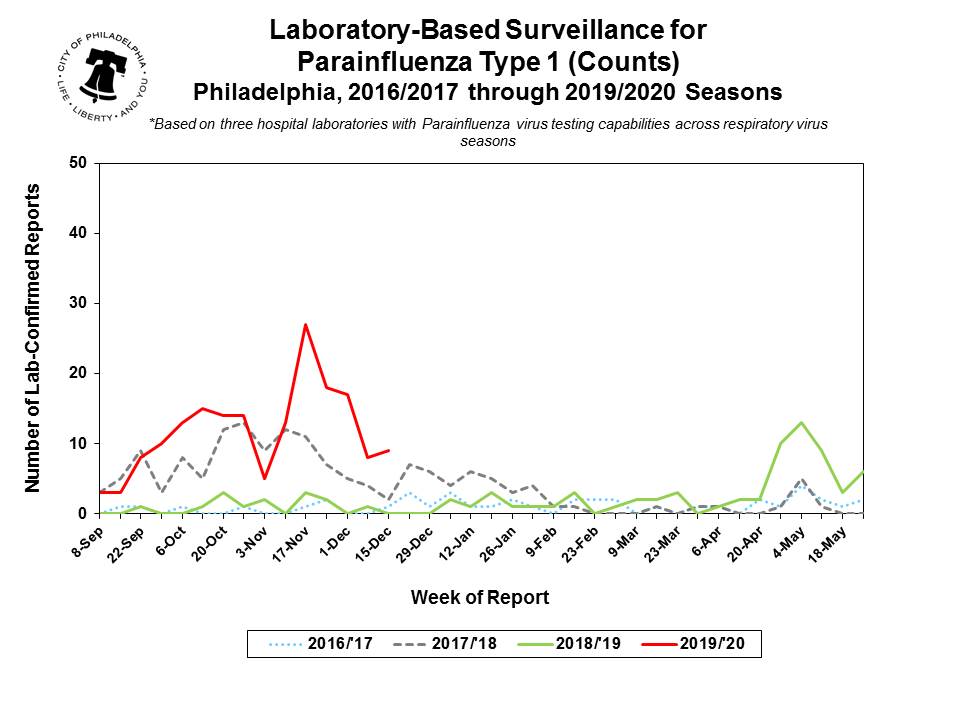
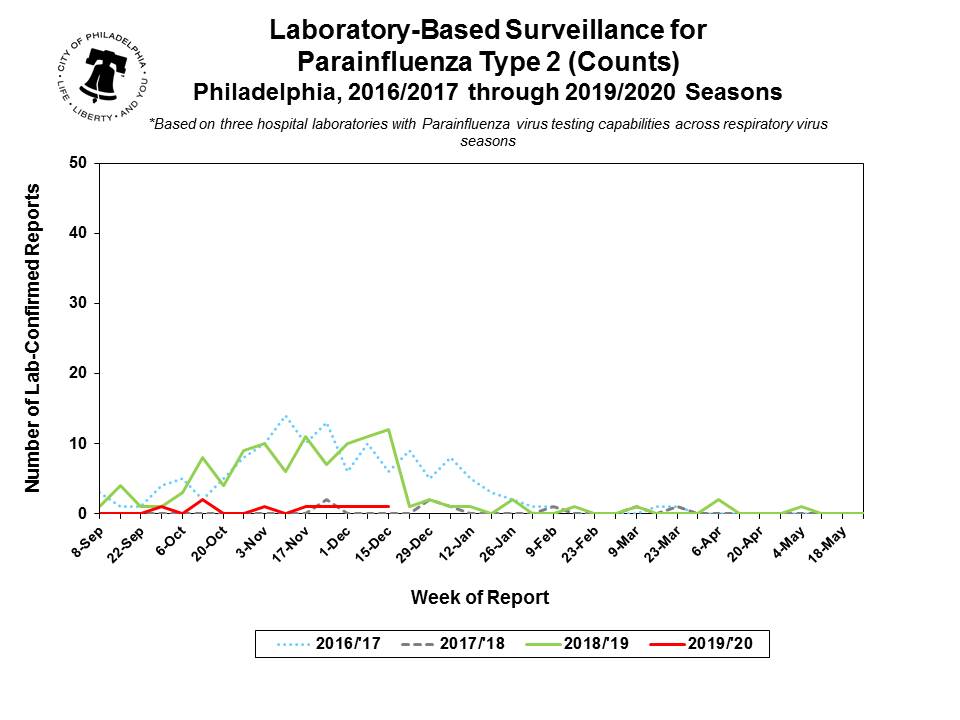
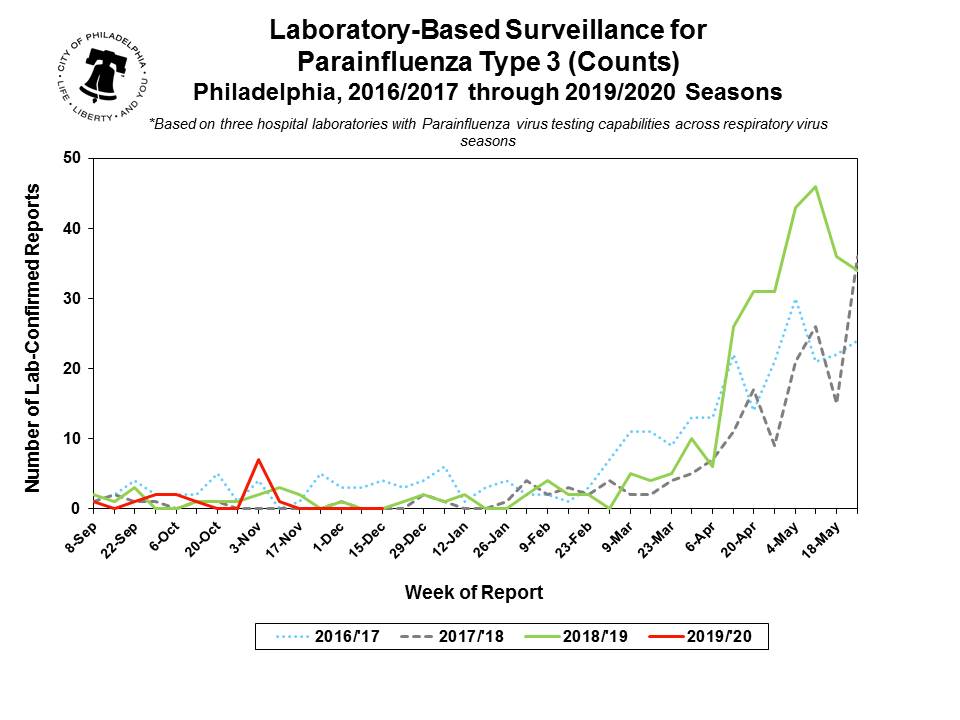
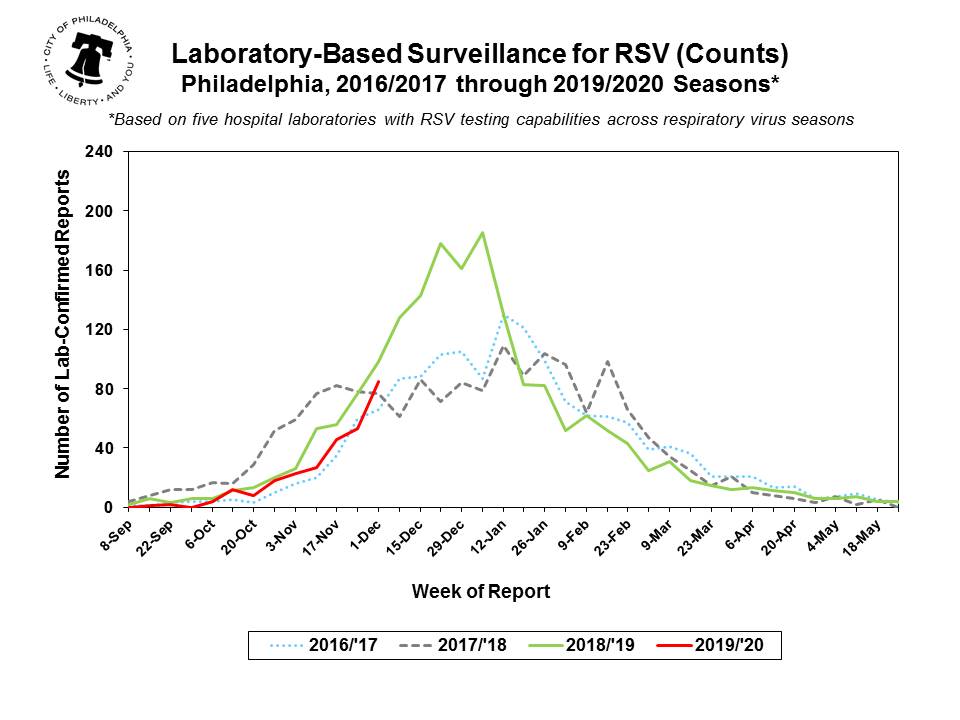
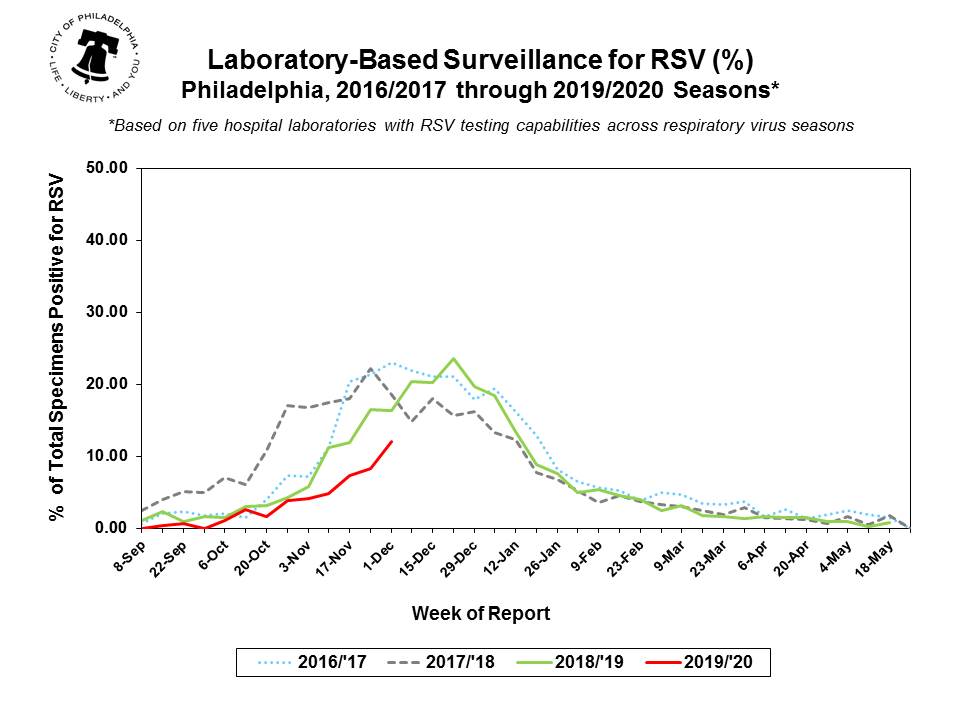
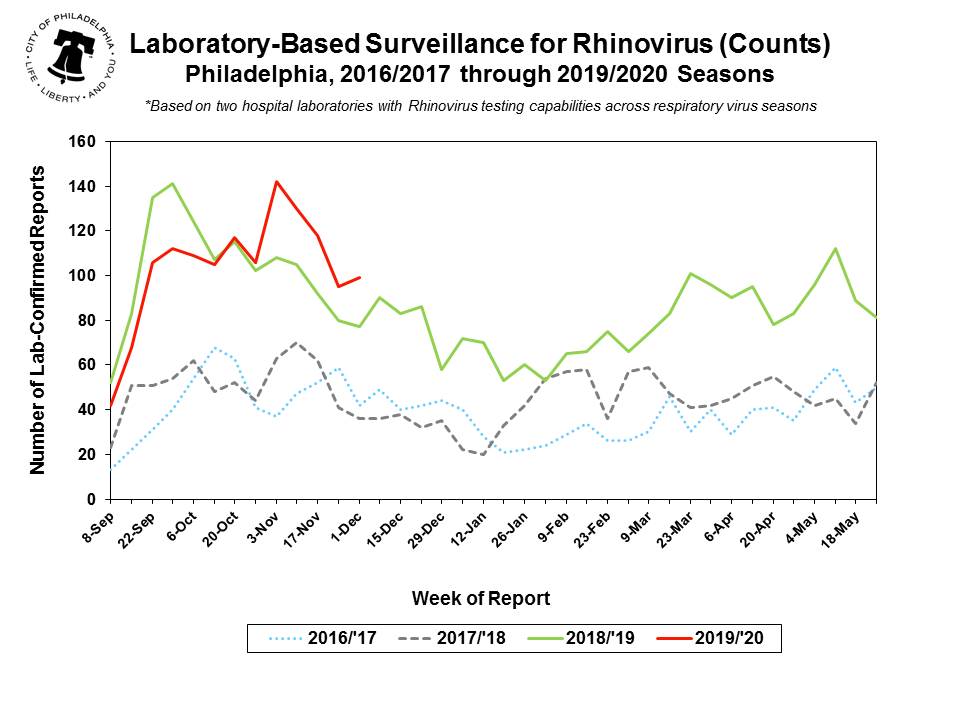
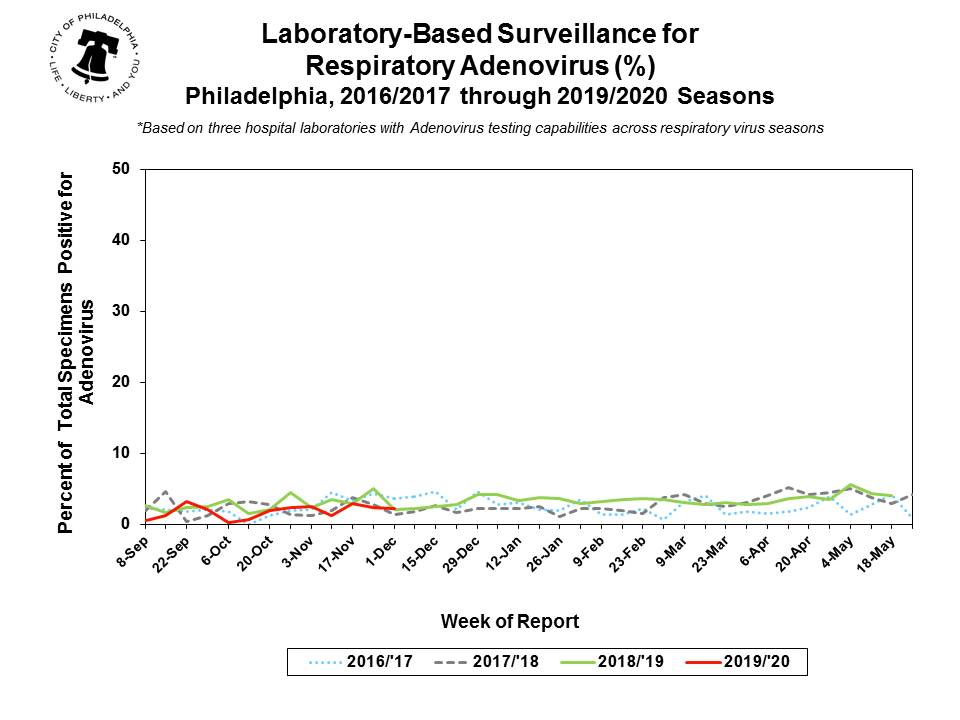
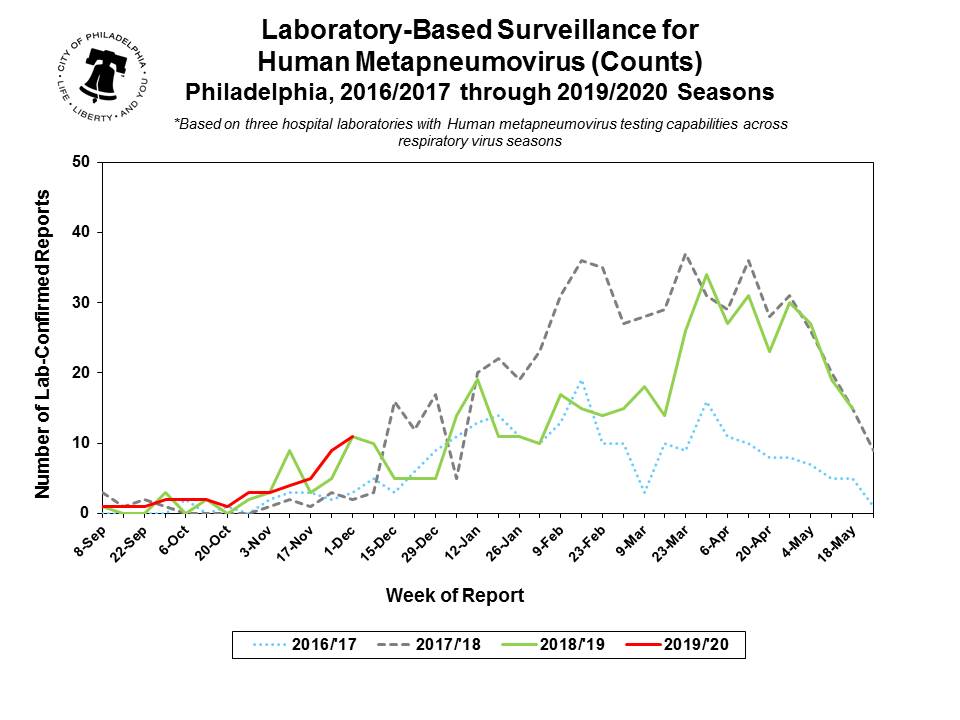
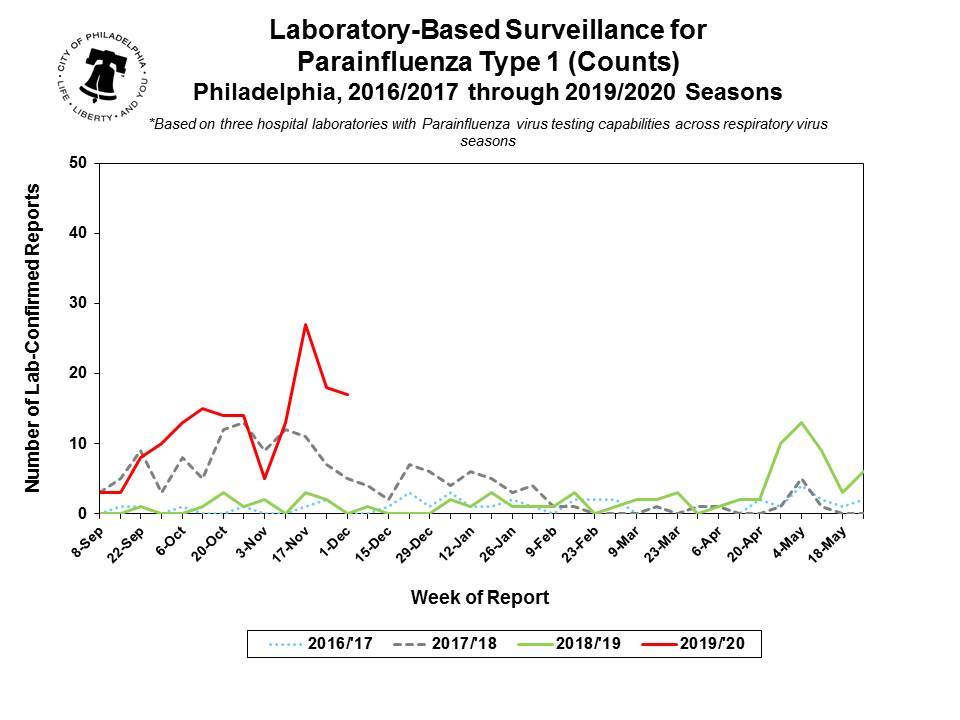
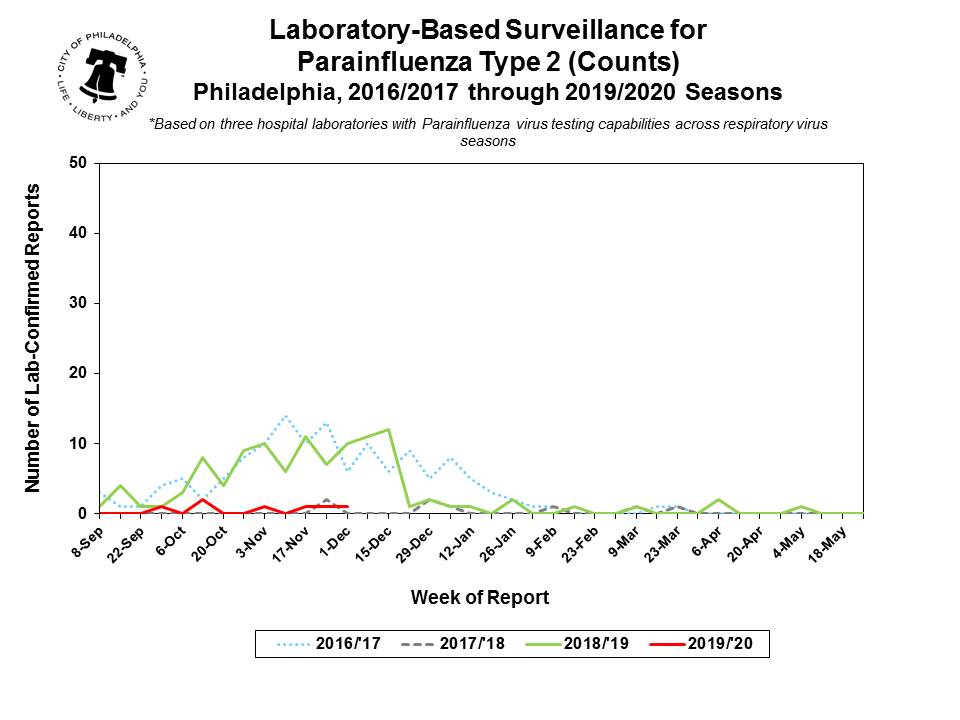
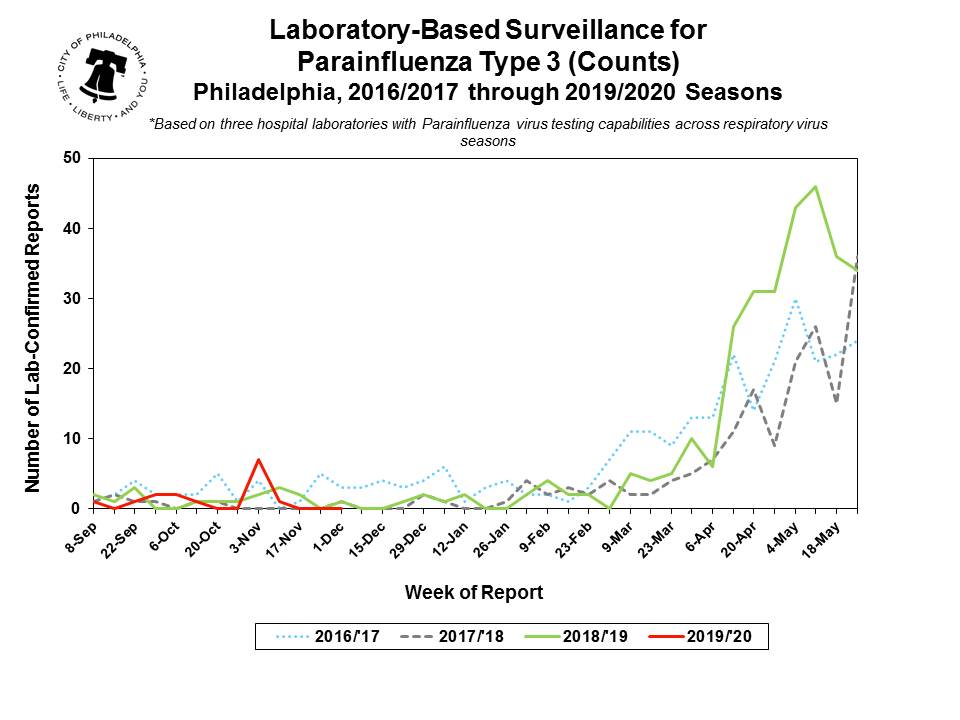
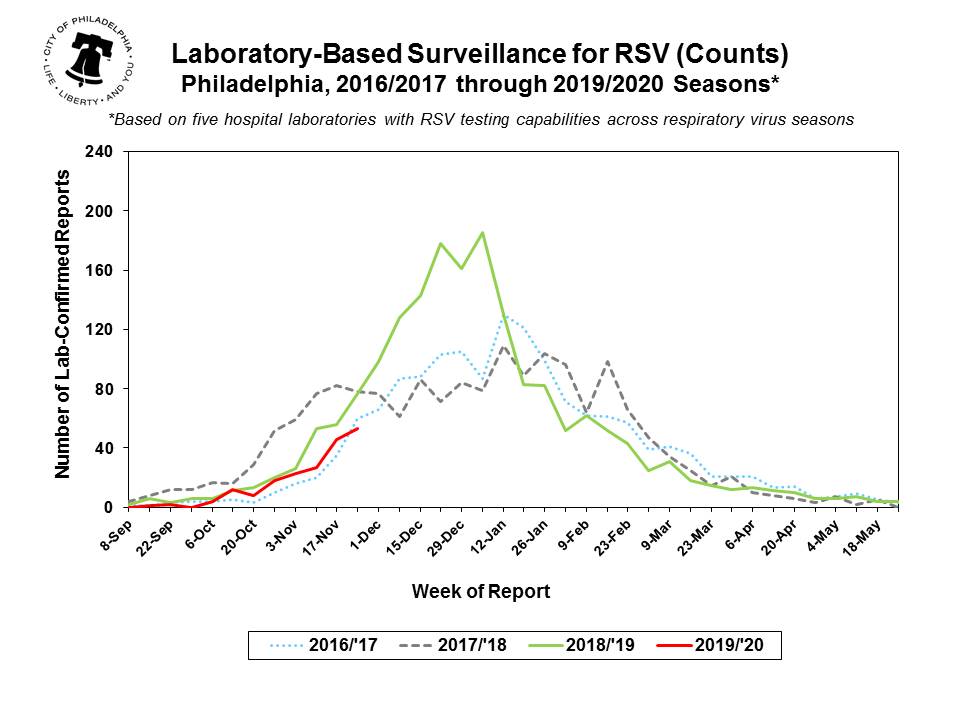
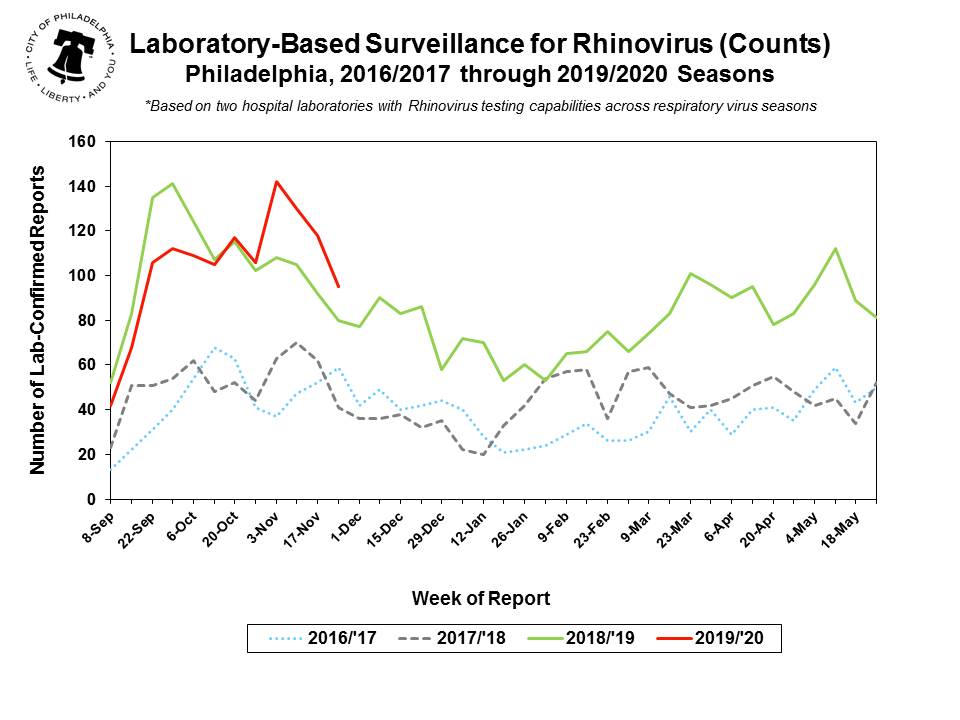
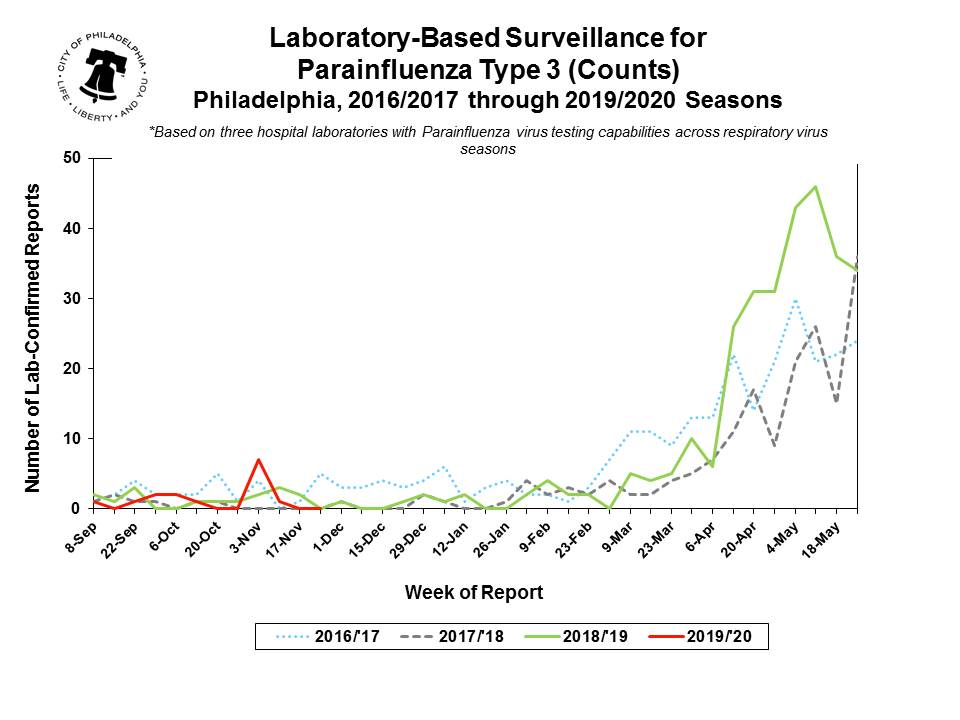
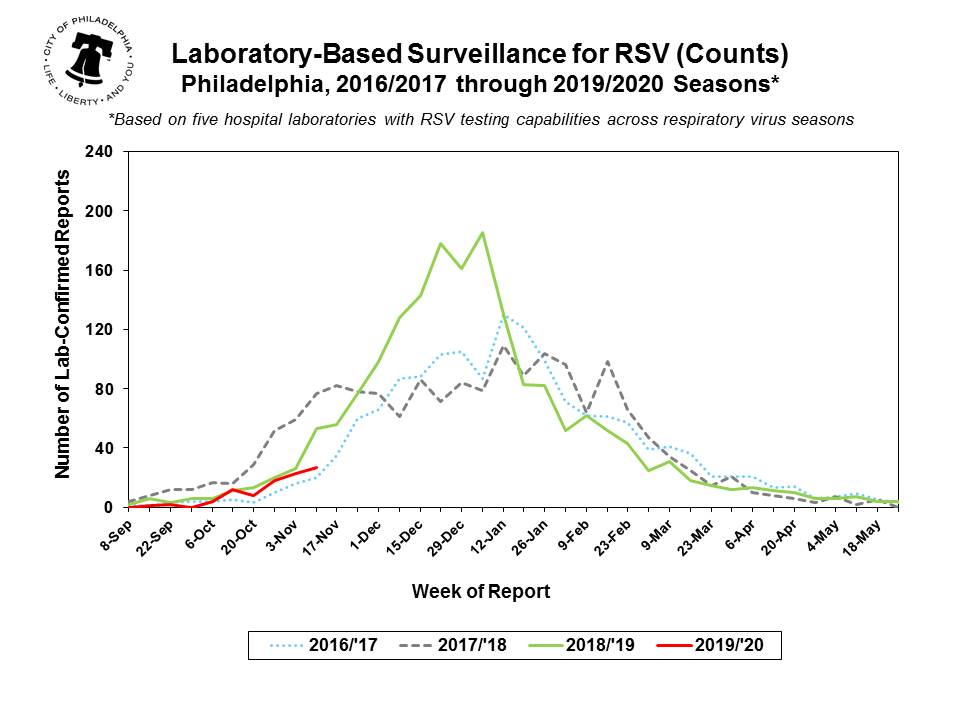
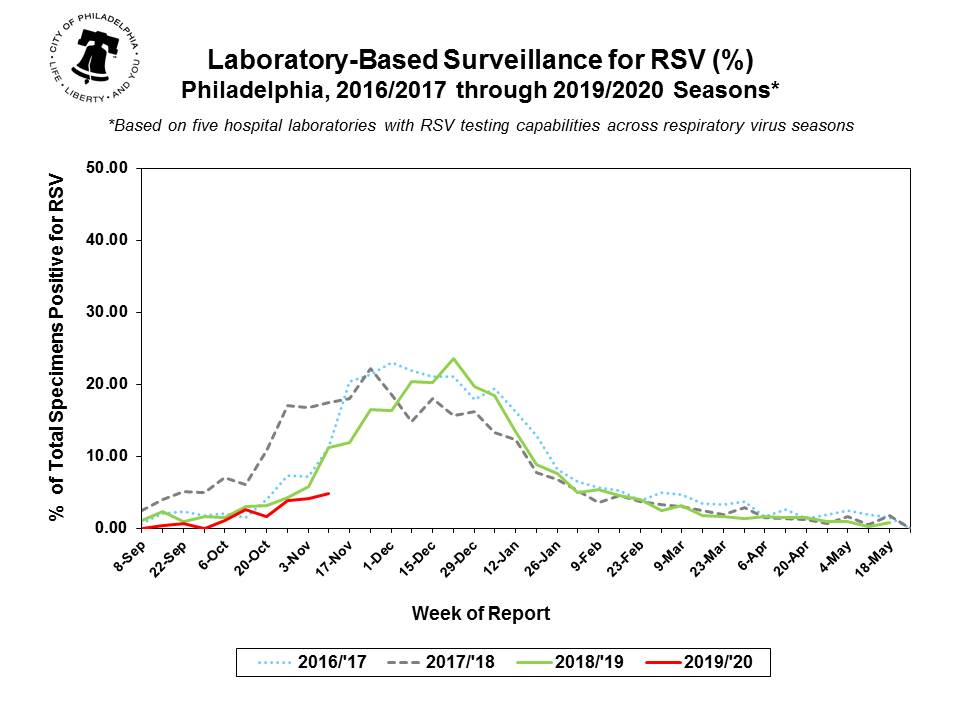
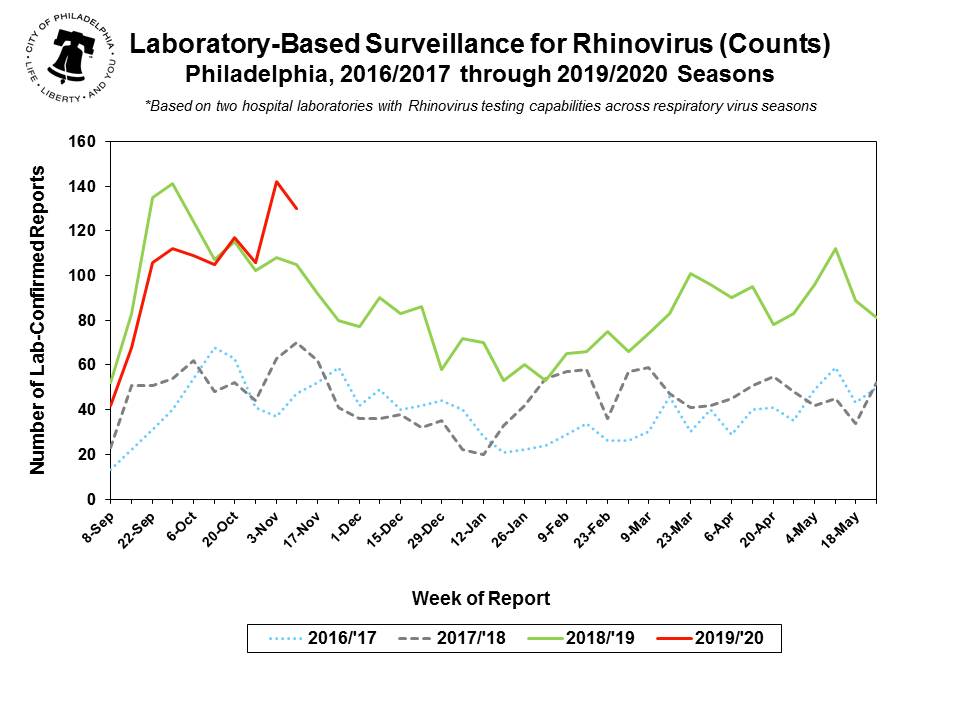
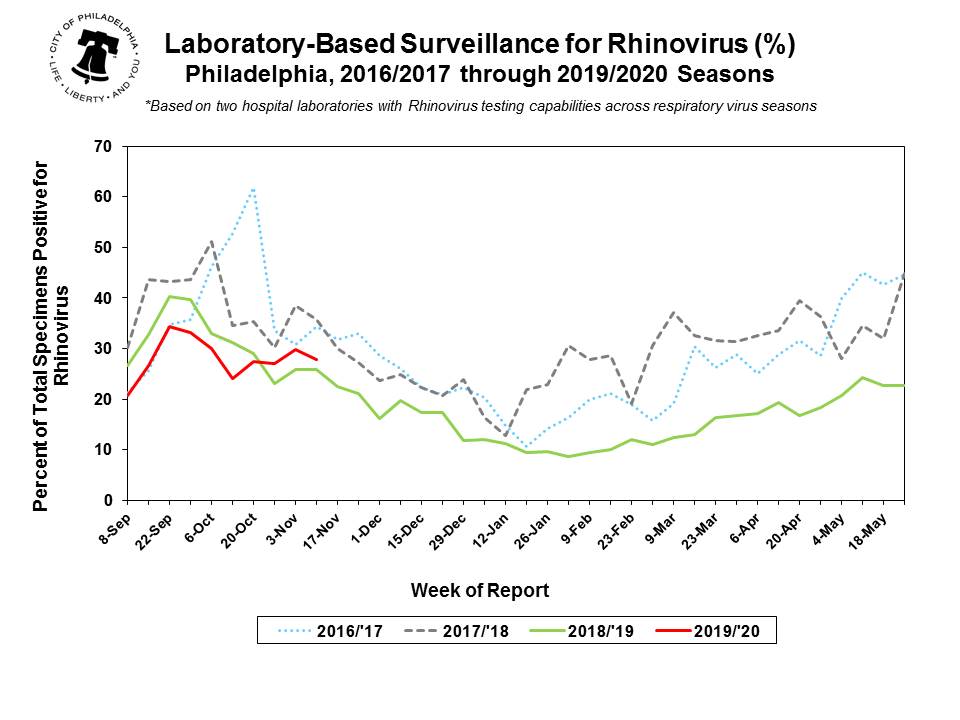
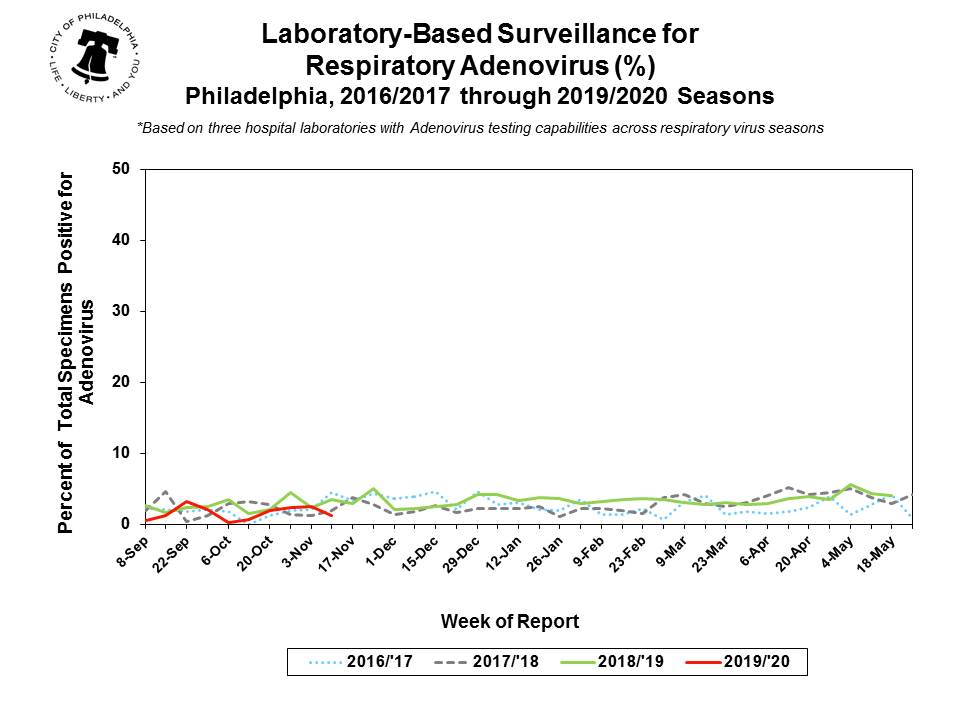
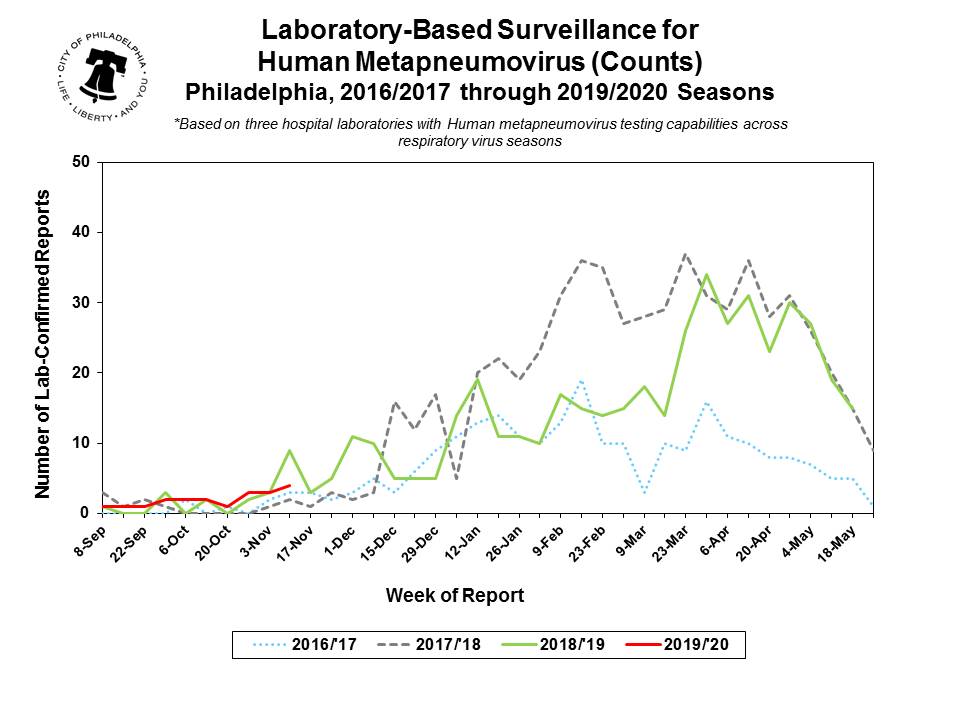
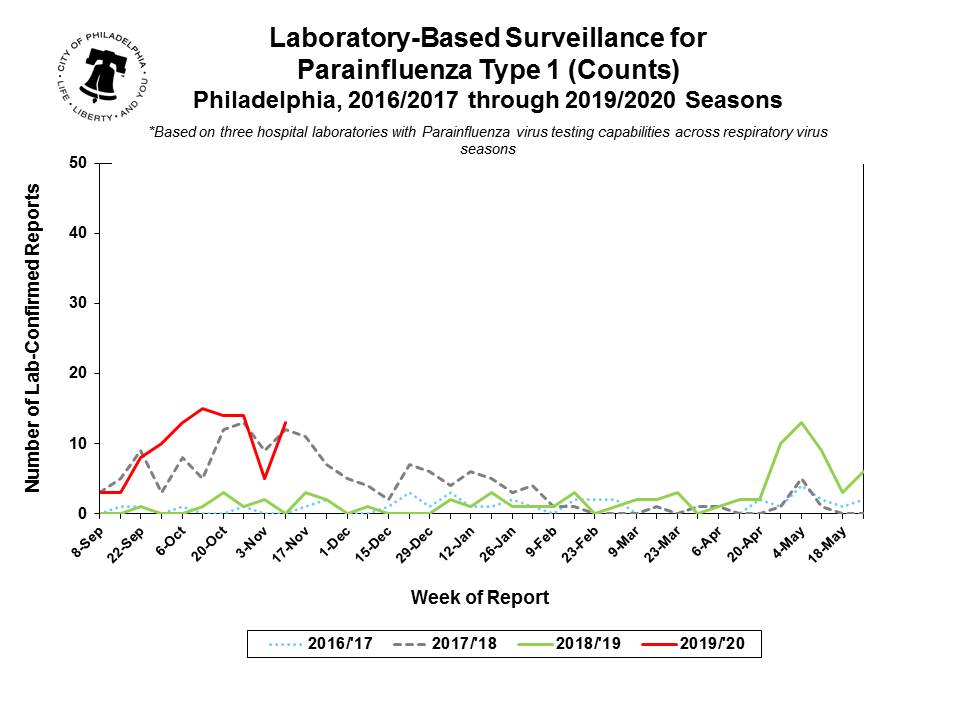
The following graphs depict the aggregate results of PDPH's respiratory virus surveillance. Care should be taken with the interpretation of these results.
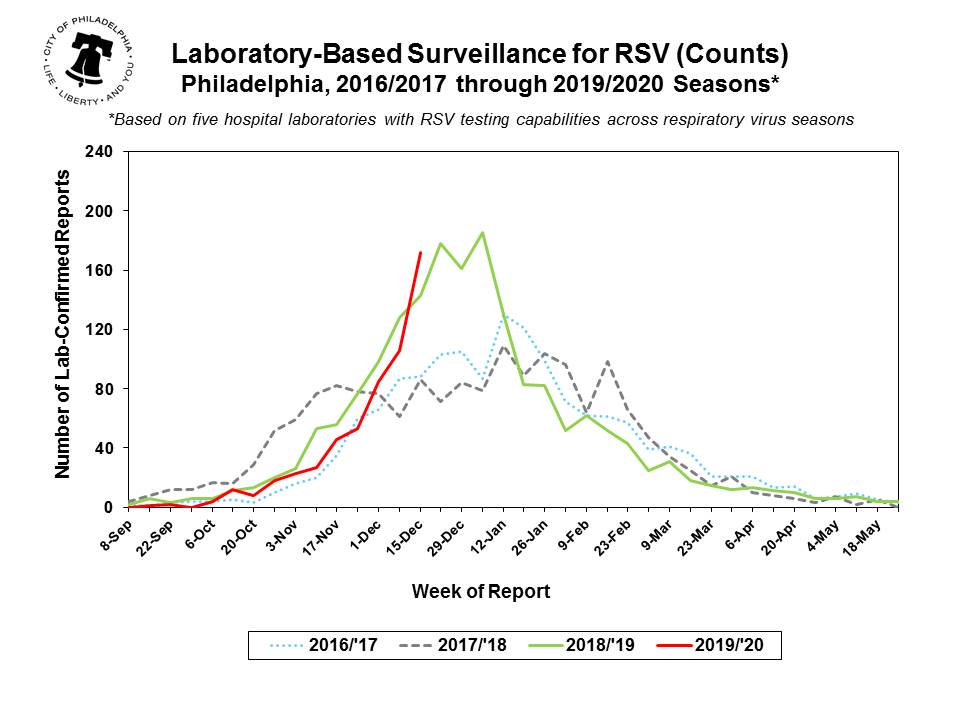
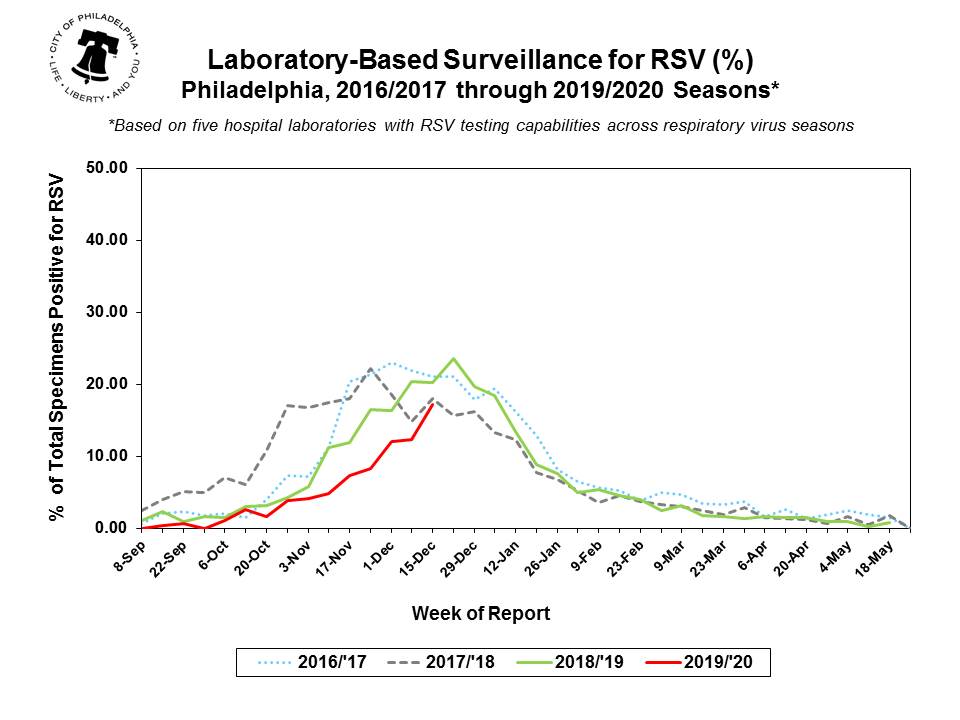
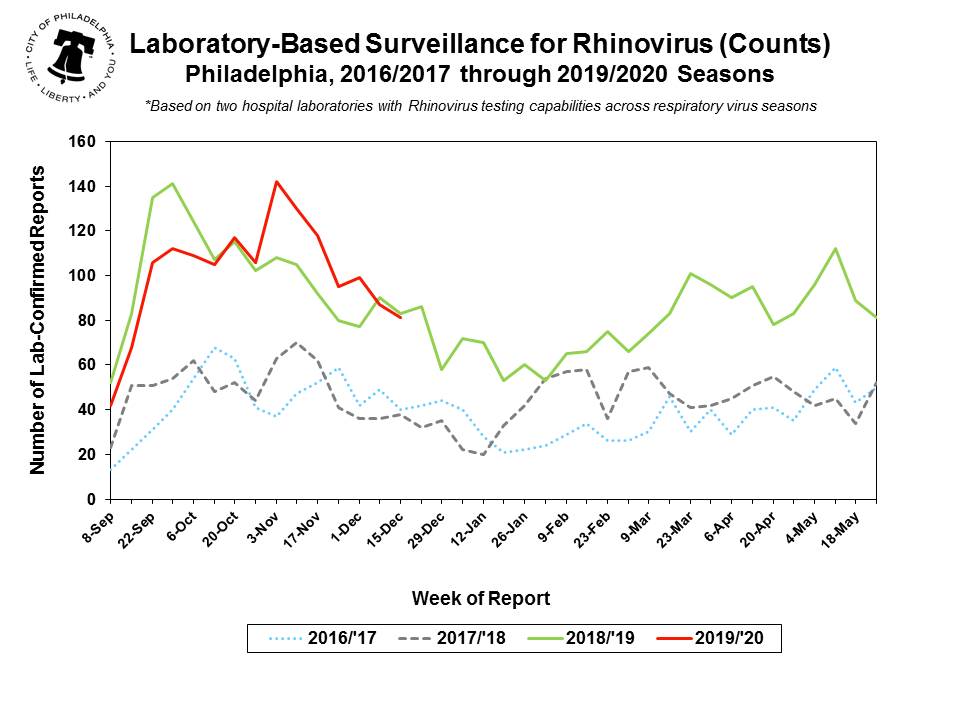
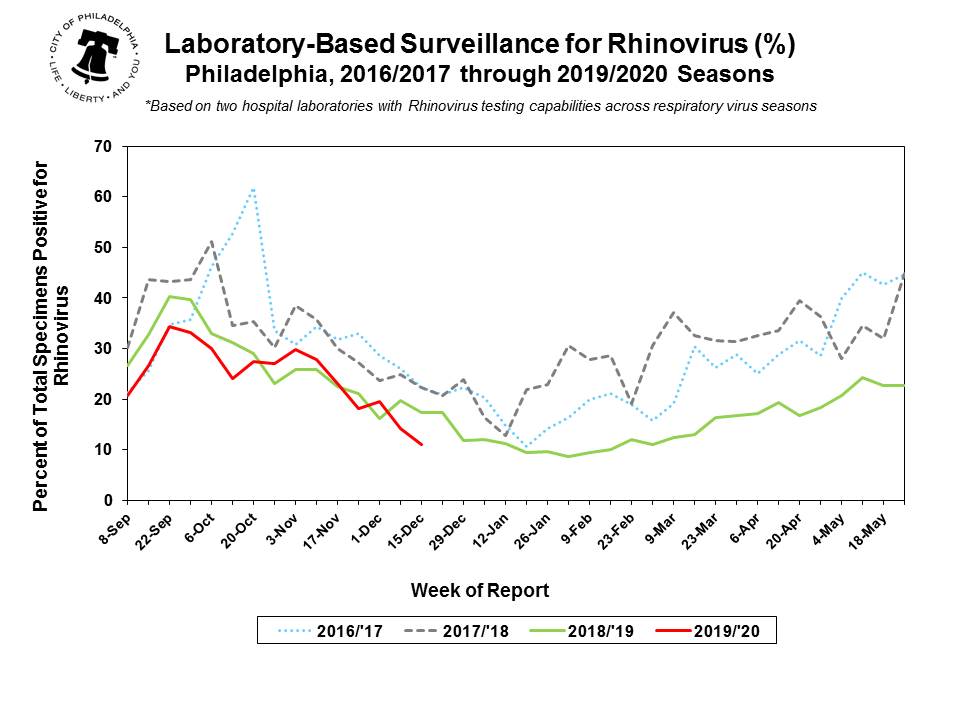
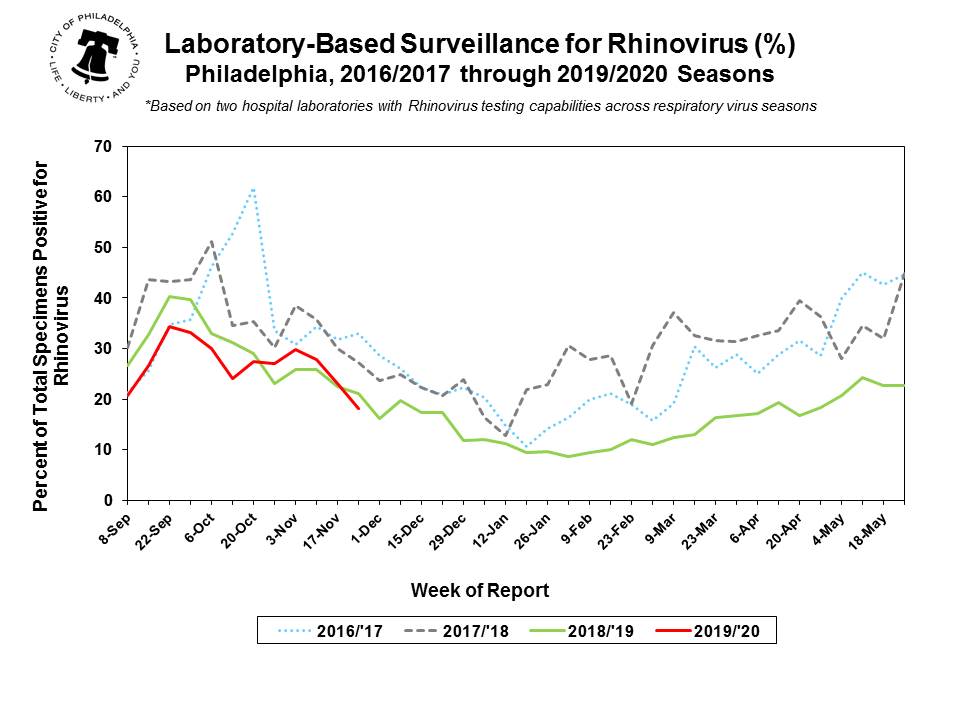
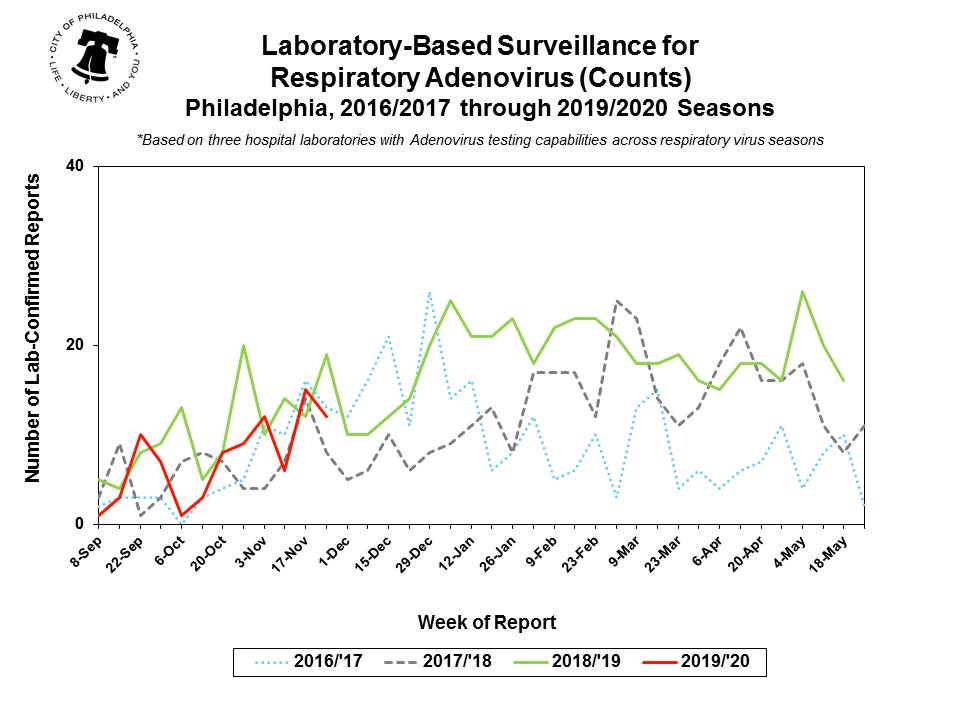
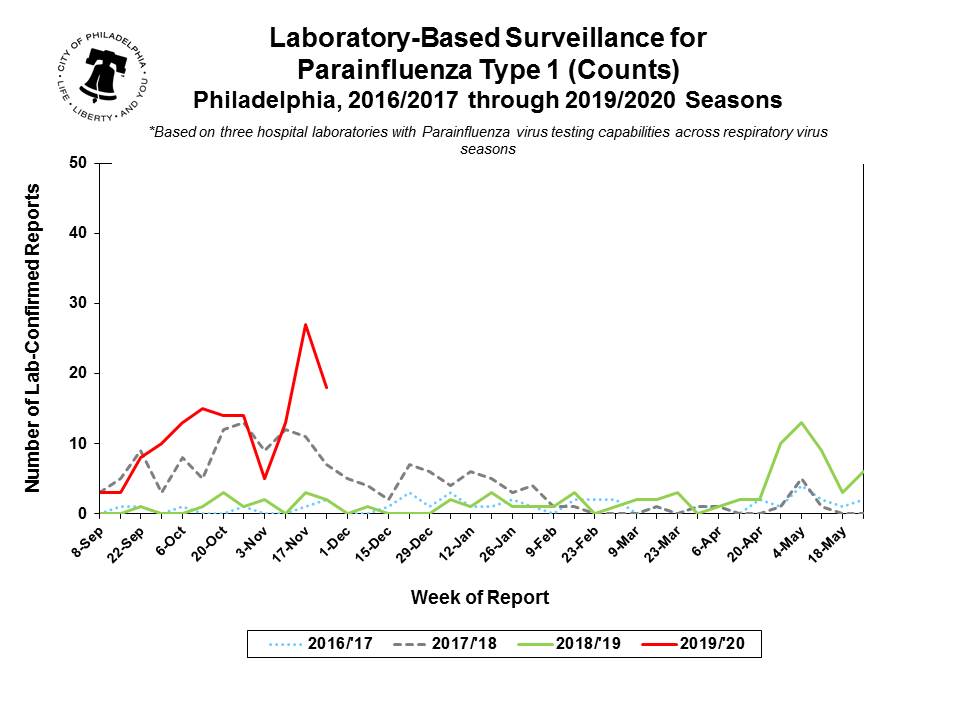
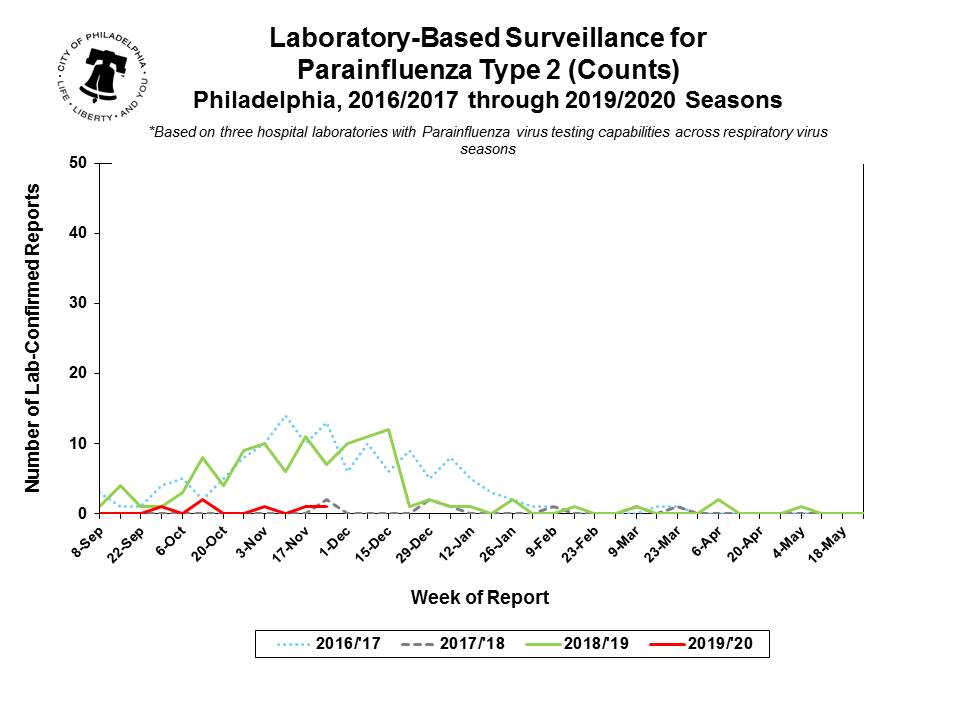
These summaries display the provisional, year-to-date counts (or, in some cases, percentage positivity) of respiratory viruses by week of report. Comparable data for preceding years are shown as well.
All surveillance data are preliminary and are not intended for further distribution.
RSV |
Rhinovirus |
Respiratory Adenovirus |
Metapneumovirus |
Parainfluenza |
RSV |
Rhinovirus |
Respiratory Adenovirus |
Metapneumovirus |
Parainfluenza |
RSV |
Rhinovirus |
Respiratory Adenovirus |
Metapneumovirus |
Parainfluenza |
RSV |
Rhinovirus |
Respiratory Adenovirus |
Metapneumovirus |
Parainfluenza |
RSV
|
Rhinovirus
|
Respiratory Adenovirus
|
Metapneumovirus
|
Parainfluenza
|
RSV
|
Rhinovirus
|
Respiratory Adenovirus
|
Metapneumovirus
|
Parainfluenza
|
RSV
|
Rhinovirus
|
Respiratory Adenovirus
|
Metapneumovirus
|
Parainfluenza
|